
Analysis and Reporting
If your meetings keep returning to whether the numbers are right, decisions wait.
Analysis and reporting make data useful for the people making decisions. That takes a dashboard that answers the right questions, definitions everyone shares, and an analyst who knows what sits underneath the numbers.
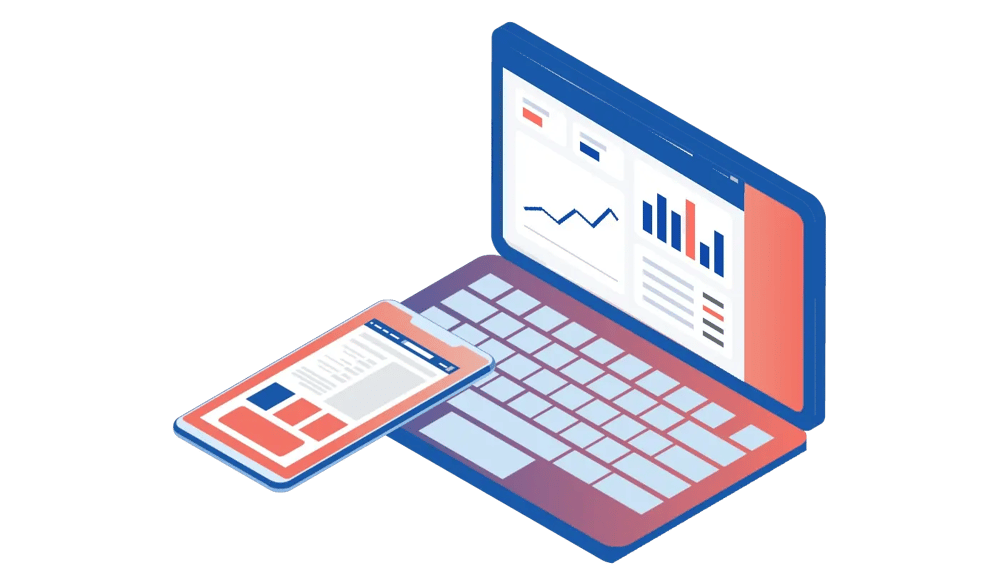
Why does nobody use our dashboard?
If getting an answer from a dashboard takes more effort than asking an analyst, people stop using the dashboard.
The data might be accurate. But there may be too many metrics, questions nobody regularly asks, or definitions that don't match the numbers used elsewhere in the business. Someone ends up asking an analyst to pull the numbers before every meeting anyway.
We start with the decisions people need to make and the questions that come up regularly. That determines what belongs in the reporting layer, the level of detail required, and who needs to see it.
We saw this at an international fashion group.
Its B2B teams said it plainly in interviews: "Dashboards are too high level." "No KPI framework for me or my team." "Sources are not connected." Most questions still went to one analyst. So we agreed the KPIs per role first, and only then built role-based reports on top, plus a sandbox where analysts could go deeper.
Reporting gives you numbers. Analysis guides how you use them.
A report might show that conversion fell from 4.2% to 3.6% last month.
Analysis looks at what changed: traffic mix, individual markets, the checkout experience, or other factors affecting performance. It also establishes whether the change is significant enough to act on.
Same drop, two jobs

Reporting should handle the questions your teams ask repeatedly, without an analyst rebuilding the answer every week. Analysts should spend their time on the changes, patterns and decisions that need their expertise.
Most organisations buy reporting and expect analysis. They are different jobs, and we build for both.
It depends on what you already run and who needs to maintain it.
We work with Looker, Looker Studio, Power BI and Tableau. We also build custom reporting on BigQuery where an off-the-shelf reporting tool is not the right answer.
LookerLooker StudioPower BITableauBigQuery
The tool needs to fit the data, the people using it, and the team maintaining it afterwards.
Looker, Power BI, or something else entirely
We don't start with a feature comparison and declare one tool the winner. If your organisation works extensively in Microsoft and has an internal team maintaining Power BI, replacing it needs a good reason. The same applies to an established Looker or Tableau environment.
Where does CND fit with our team?
Where your team needs us. That depends on what it already does well and which expertise is missing.
Build the reporting layer
So your internal analysts can concentrate on analysis.
Fix what sits underneath
Improve the data model under the dashboards you already have.
Add analytical capacity
Extra analysts alongside an established team.
Secondment
A consultant in your team for a defined period, for capacity or specialist expertise.
Frequently asked questions
-
Can you work alongside our own analysts?
Yes. A common setup is that we build and maintain the reporting layer, and your analysts spend their time on the questions that need them.
-
Do you replace our existing dashboards?
Only when there is a reason to. If the problem sits in the questions or the definitions, a new dashboard gives you the same problem in a different tool. We usually start with what you already run.
-
Which reporting tool do you recommend?
The one your team can keep running. We work with Looker, Looker Studio, Power BI and Tableau, and build on BigQuery where an off-the-shelf tool isn't the right answer.
Start with the question.
Tell us what your teams are trying to understand or decide. We'll look at the data underneath, establish what belongs in reporting, and identify where analysis is needed.
Data Model and Definitions
One definition per metric, used by every report and team.
Data Warehouse
Bring your data together in one place you control.
Campaign Measurement
Find out what your campaigns are really contributing.
Contact details
Cloud Nine Digital
Johann Siegerstraat 24
1096 BH
Amsterdam, Netherlands
T: +31 (0)20 787 1323
E: info@cloudninedigital.nl
Need something else?
Please do reach out. We are happy to help!